

CIPD Voice On... the labour market, by Jon Boys, CIPD's Labour Market Economist.
Last month I talked to the Lords economic affairs committee for their ‘enquiry where have all the workers gone?’. This is a topic of particular interest to the HR profession as they face intense recruitment and retention pressures.
In this blog, I will be discussing a group that is of particular concern to policymakers, the 50–64-year age group. This group has seen increased rates of inactivity (neither employed nor unemployed, but in a third category). Reasons for inactivity include ill health, retirement, and studying amongst others. This blog seeks to answer the question – ‘To what extent do demographic changes explain the increase in inactivity for the 50–64-year age group?’
The first thing to note is just how diverse the 50–64-year age group is. While 50-year-olds have an inactivity rate of 15%, this rises to 51% for 64-year-olds (using the latest labour force survey microdata – April-June 2022). 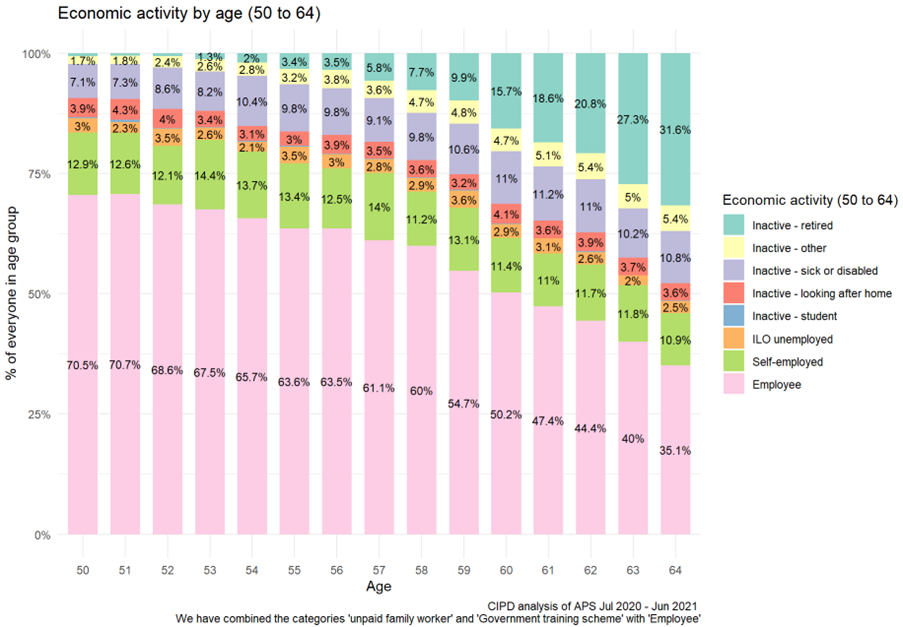
The second thing to note is that the population is bumpy. Birth booms and busts have left us with echoes in the population profile. Given that the inactivity rate is higher for older people, a changing age profile that shifted a higher proportion of 50–64-year-olds towards older ages would increase the rate of inactivity. In addition to this, an increase in the size of the population would also increase the absolute number of people inactive. This is something we can check.
We use the inactivity rates of each individual age (50, 51, 52…) in the pre-pandemic period and apply these to the post-pandemic population. This tells us what inactivity would have been if things had stayed the same. 15.5% of the increase in inactivity can be attributed to the changing age profile, and 26.4% can be attributed to the increase in population size. This means that 58.1% of the increase in inactivity is unexplained (Table 1). It can be attributed to an increase in the rate of inactivity for 50–64-year-olds. Another way of putting this is to say that about two-fifths of the increase in inactivity of 50–64-year-olds was expected given demographic change.
The big question is how can we explain three-fifths of the increase in inactivity for 50–64-year-olds and what can we do about it? There is no conclusive answer to this question, and it appears to be a combination of factors. Increased ill-health perhaps caused by long-COVID and longer NHS waiting lists, as well as changing preferences and early retirement.
The CIPD’s report understanding older workers looks at the ways people work at different ages and makes recommendations that may help tackle the increase in inactivity. Older people are more likely to work flexibly including part-time, from home, and self-employment. This underlines the importance of ensuring employers take steps to increase the availability and range of flexibility as a means of both attracting and retaining workers as they get older. Older people are also more likely to have a health condition that limits the work they can do. This highlights the importance of both employers and policymakers taking steps to support the health of workers throughout their working lives, to maximise their chances of them enjoying a healthy and active life as they get older.
Notes and further analysis –
- These sums were arrived at after back and forth with the clerks to the committee and Robert Joyce who is advising the committee.
- For the pre-pandemic period, we used the annual population survey January-December 2019 available from the UK data service.
- For the post-pandemic period, we used the labour force survey April-June 2022 available from the UK data service.
Table 1: numbers for the 50-64 age group pre and post-pandemic
|
Category |
Absolute numbers |
% Change in inactivity attributable to |
|
pre-pandemic inactive count |
3,273,211 |
|
|
post-pandemic inactive count |
3,575,843 |
|
|
post-pandemic expectation just from population increase (2019 inactivity rate * population in 2022) |
3,353,042 |
|
|
hypothetical post-pandemic count (if using inactive proportions by age of pre-pandemic population) i.e., what inactivity would have been if rate of inactivity by age stayed the same. |
3,400,040 |
|
|
|
|
|
|
increase in inactivity between pre and post-pandemic populations |
302,632 |
|
|
of which how much was due to changing age profile |
46,999 |
15.5% |
|
how much was due to population increase |
79,831 |
26.4% |
|
How much due to increased rate of inactivity |
175,803 |
58.1% |
Table 2: inactivity rates for 50-64 age group pre and post-pandemic
|
|
Inactivity rates |
difference between 2019 and 2022 rate |
|
inactivity rate 2019 |
25.7% |
|
|
inactivity rate Apr-Jun 2022 |
27.4% |
1.7% |
|
inactivity rate Apr-Jun (if using 2019 percentages) |
26.1% |
0.4% |
- If we open up the age group to 16-64 to cover the general working-age population the impact of demographic change on inactivity is even greater. Almost half (47%) of the increase in inactivity can be attributed to demographic changes.
Table 3: Numbers for the 16-64 group, pre and post-pandemic
|
Category |
Absolute numbers |
% change in inactivity attributable to |
|
pre-pandemic inactive count |
8,773,877 |
|
|
post-pandemic inactive count |
9,018,807 |
|
|
post-pandemic expectation just from population increase (2019 inactivity rate * population in 2022) |
8,805,449 |
|
|
hypothetical post-pandemic count (if using inactive proportions by age of pre-pandemic population) i.e., what inactivity would have been if rate of inactivity by age stayed the same. |
8,888,873 |
|
|
|
|
|
|
increase in inactivity between pre and post-pandemic populations |
244,930 |
|
|
of which how much was due to changing age profile |
83,424 |
34.1% |
|
how much was due to population increase |
31,572 |
12.9% |
|
How much due to increased rate of inactivity |
129,934 |
53.0% |
Table 4: inactivity rates for 16-64 age group pre and post-pandemic
|
|
Inactivity rates |
difference between 2019 and 2022 rate |
|
inactivity rate 2019 |
21.2% |
|
|
inactivity rate Apr-June 2022 |
21.7% |
0.5% |
|
inactivity rate Apr-June 2022(if using 2019 percentages) |
21.4% |
0.2% |
- Finally, we can also use this method to look at the 5-year period before the pandemic. At this time the population was increasing (which should all things equal increase inactivity), but the rate of inactivity was decreasing. The net effect was a reduction in the absolute numbers of people inactive.
Table 5: Numbers for the 50-64 group, in the five years before the pandemic
|
Category |
Absolute numbers |
% change in inactivity attributable to |
|
2014 (Jan-Dec 2014 APS data) inactive count |
3,398,804 |
|
|
2019 (Jan-Dec 2019 APS data) inactive count |
3,273,211 |
|
|
2019 expectation just from population increase (2014 inactivity rate * population in 2019) |
3,688,821 |
|
|
2019 count (if using inactive proportions by age of 2014) i.e., what inactivity would have been if rate of inactivity by age stayed the same. |
3,680,081 |
|
|
|
|
|
|
Change in inactivity between JD2014 and JD2019 |
-125,593 |
|
|
of which how much was due to changing age profile |
-8,740 |
7.0% |
|
how much was due to population increase |
290,017 |
-230.9% |
|
How much due to changing rate of inactivity |
-406,870 |
324.0% |
Table 6: inactivity rates for 50-64 age group in the five years before the pandemic
|
|
|
difference between 2014 and 2029 rate |
|
inactivity rate 2014 |
29.0% |
|
|
inactivity rate Jan-Dec 2019 |
25.7% |
-3.3% |
|
inactivity rate Jan-Dec 2019(if using 2014 percentages) |
28.9% |
-0.1% |
inactivity of 50 to 64 queries (2).xlsx

