4

Seeking Industry Benchmarking and Suggestions for PAYE Absence Management

Dear Forum Members,

We are a construction company with a diverse workforce, including PAYE employees, agency workers, consultants, and sub-contractors.

Currently, we are focusing on managing the absence of our PAYE employees and are seeking industry benchmarks to highlight areas for improvement.

Our current reporting includes the following:

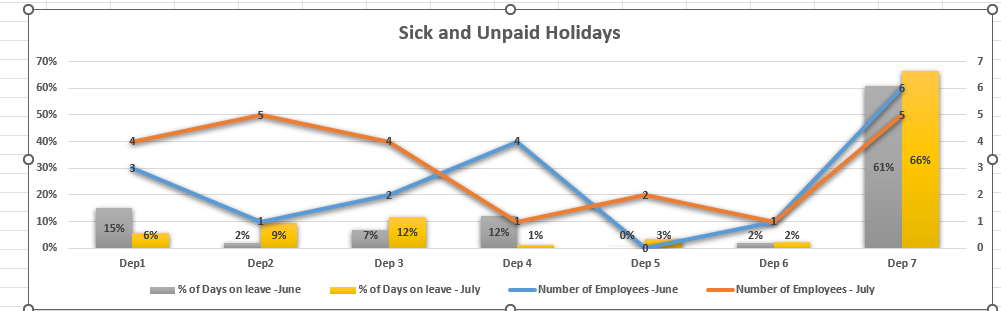
  • Absence Type: Sick leave, unpaid leave
  • Department Name
  • Percentage of Leave Taken by Each Department: To show downtime and improve resource management
  • Comparison Between Last Month and This Month: To show if there has been improvement and what can be done to reduce these absences

Our company directors are interested in understanding how other similar companies manage their workforce absence. We would appreciate any suggestions on what can be done to improve our process and if there are better ways to present this information.

Our current absence management process includes:

  • Regular and Detailed Monitoring of Absence: Using software and the Bradford Factor calculation to highlight and address excessive absence
  • Health and Well-being Sessions: Offering counseling sessions
  • Absence Management Training: Provided at regular intervals to all managers and supervisors
  • One-on-One Support: For employees willing to improve their attendance

Attached a sample visual for reference.

Thank you for your assistance in advance.

Kind regards

Nisha Patel

193 views
  • I found the graph to be a bit confusing and hard to grasp the key points. Perhaps to someone within the business it all makes sense?

    Just some random thoughts.

    Drawing a line between different departments is confusing as it seems to imply there is a changing relationship between them, this might be correct if people are constantly shifting departments for whatever reason but then calculating absence rates by department does not give you any actionable data.

    I can see in June/July there was a total headcount change of 1 employee, is this significant and does it related to sickness?

    Generally giving absence rates in days is easily understood by everyone, using percentages over a month forces the reader to work quite hard, eg 2% absence in June is not the same as 2% in July.

    I would split holidays from sickness, as they are quite different, if you are trying to focus on sickness then the holiday data just confuses things.
  • In reply to Steven :

    Hi Steven

    Thank you for your response and attention to detail on the report.

    We will try and present in a better way as advised the next time.

    Thank you.
  • In reply to Nisha :

    Nisha, have a look for Edward Tufte he has done a lot of work on presentation information.

    A really useful tool if you are measuring the same thing over time is a statistical process control chart (SPC). Sounds fancy but is easy to create and use, this tool will help you and the business make better decisions. For a good description search for Mark Graban Control Chats on YouTube.
  • In reply to Steven :

    Steven, Much appreciated

    Thank you so much!